Take a look at our
ThinkPads.com HOME PAGE
For those who might want to contribute to the blog, start here: Editors Alley Topic
Then contact Bill with a Private Message

Battery capacity charts - updated January 2017 (*PICS*)

General Questions, Rumors, Real news & More
Message
Author
dr_st
Admin
Admin
Posts: 9701
Joined: Sat Oct 29, 2005 6:20 am
Location: Israel

Battery capacity charts - updated January 2017 (*PICS*)

#1 Post by dr_st » Tue Jan 10, 2017 4:16 pm

Almost 8 years ago I started this thread documenting the actual decrease of battery capacity over time, based on the sample of batteries I had in my various Thinkpads. The thread led to some interesting discussions and a strong confirmation of what was already suspected previously - that longevity varies greatly based on manufacturer, with Panasonic being the best, followed by Sanyo, and Sony being last. During the subsequent ~2 years I updated that thread from time to time with new numbers, but later stopped, as it got too time consuming to keep track of, and also it seemed that no new information was to be gained from it - only existing data confirmed. Privately, I continued sampling some of the batteries every now and then, but never published it.

Fast forward several years and I felt like another update may be useful now, due to the following changed circumstances:
  • I have gotten a few more Thinkpads and a few more batteries to analyze
  • The existing batteries on the list have aged significantly, to the point where additional effects may be observed
  • A new manufacturer (LGC) has joined the list of Thinkpad battery vendors
  • Changes in the battery cell making business (in particular, the merge between Sanyo and Panasonic) may have led to changes in the relative quality
So I decided to dust off all of my batteries, cycle each a couple of times (for gauge calibration) and update the table.

The results I proudly present to you in the table below. All the data was obtained from Thinkpad Power Manager (or in Windows 10 - Lenovo Settings app). Most of the information is pretty self-explanatory. The age of the battery is measured in months from the manufacturing date, not the first used date. I have seen in the past that the first used date gets reset for an unknown reason, but the manufacturing date always appears accurate. The battery name reflects the laptop, the cell count, and a running counter for differentiation, in cases where I had more than one such battery. Information is accurate as of January 2017.

Code: Select all

  Battery    FRU     Brand  Manufactured First used Design Capacity (Wh) Age(months) Cycles Capacity (Wh) % Original  Notes
 A31p-6c-1 02K6898 Sanyo      Aug-02       Jun-11         43.20             173        25       18.05        41.78%
  T42-6c-1 08K8193 Sanyo      Mar-05       May-05         47.52             142       222        6.26        13.17%
  T42-9c-1 42T4608 Sanyo      Apr-10       Oct-10         77.76              81       319       51.26        65.92%     *
  X32-6c-1 92P1096 Panasonic  Oct-06       Dec-06         51.83             123       254       39.57        76.35%     *
  X32-6c-2 92P1096 Panasonic  Aug-05       Apr-08         51.83             137       288       38.85        74.96%
  T60-9c-1 92P1133 Panasonic  Aug-06       Oct-06         84.24             125       235       66.87        79.38%     *
  T60-9c-2 92P1133 Panasonic  May-07       Jun-07         84.24             116       426       60.83        72.21%
  T60-6c-1 92P1139 Panasonic  Jul-06       Aug-06         56.16             126       190       40.08        71.37%
  T60-6c-2 42T4504 Sanyo      Jul-08       Dec-08         56.16             102       231       28.40        50.57%     *
  X61-4c-1 42T4505 Sanyo      Mar-08       Dec-08         37.44             106       223       13.46        35.95%
  X61-8c-1 42T4571 Sony       Aug-08       Nov-08         74.88             101        87       74.88       100.00%     **
 T410-9c-1 42T4801 Panasonic  Sep-10       Nov-10         93.96              76       212       88.79        94.50%
 T410-6c-1 42T4911 LGC        Jul-10       Dec-10         56.16              78       241       55.04        98.01%     *
 T410-6c-2 42T4793 Panasonic  Jul-10       Dec-10         56.16              78        10       57.38       102.17%     *
 T410-6c-3 42T4795 Sony       Jul-11       Dec-16         56.16              66         7       61.78       110.01%     *
 X220-9c-1 42T4940 Sanyo      Oct-11       Jan-12         93.24              63       150       77.23        82.83%     *
 X220-6c-1 45N1025 LGC        Nov-12       Feb-14         57.72              50       112       44.55        77.18%
T430s-6c-1 45N1143 Panasonic  May-13       Jul-13         43.29              44        56       43.57       100.65%
 T430-6c-1 45N1001 Sanyo      Jul-13       Aug-13         56.16              42       566       12.22        21.76%     1
 T430-6c-2 45N1001 Sanyo      Jul-16       Oct-16         56.16               6        48       53.77        95.74%     2
* Indicates that the battery was not used inside of a laptop, but rather stored (typically at a partial charge level) during the last 2-4 years. This battery may have been used in a laptop prior to that, so some of them will still have a lot of cycles.
** The gauge of this Sony battery is completely inaccurate. It always shows 100% of design capacity, but the battery is obviously far from that. In real use, at some point it will jump from 60%+ to 5%. It probably holds less than 50% of its original capacity. Sony's batteries have been known for terrible gauges that don't actually reflect the capacity, but the tricks suggested to calibrate them (do 3-5 full resets) do not seem to help on this particular battery.

This time I decided not to stop with the table but also draw simple Excel charts to demonstrate battery capacity as a function of (a) age, (b) number of cycles, and grouping according to manufacturer (LGC, Panasonic, Sanyo). Sony batteries were excluded from this, because of a low sample count, and because their gauges are known to be useless.

Image
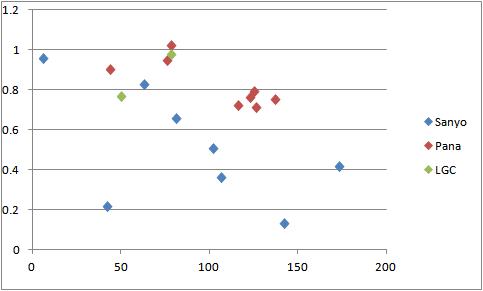
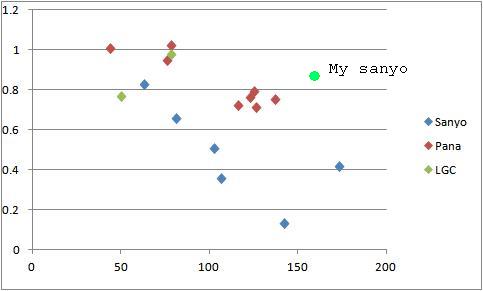
Figure 1. Battery capacity (% of design) as a function of battery age

Despite a few outliers, the figure shows a pretty clear trend of a decreasing capacity as a function of age, at least when focusing on Sanyo/Panasonic batteries. It is also very clear that Panasonic batteries retain capacity better than Sanyo. The LGC batteries are somewhat mixed - of the two I have, one behaves more like a Sanyo, one more like a Panasonic.

Image
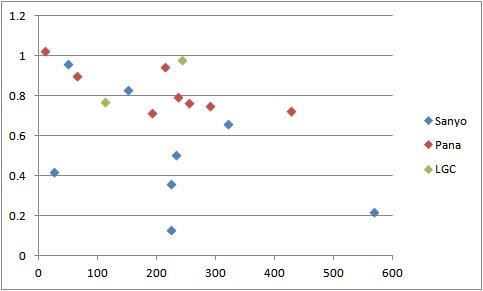
Figure 2. Battery capacity (% of design) as a function of number of cycles

Here there is no clear trend visible. There is a bunch of Sanyos showing drastically varying capacities despite similar number of cycles, and on the other hand, a bunch of Panasonic with fairly consistent capacities, despite cycles varying from under 200 to over 400. The conclusion is, thus, that age has a more crucial effect on battery than actual use. This is consistent with the findings in the earlier thread.

One exception to that may be - batteries with very low cycles, i.e., those that were almost not used at all, will typically exhibit higher capacity than their age would normally indicate (the outliers here are T410-6c-2, A31p-6c-1, and also T410-6c-3, which is not pictured, being a Sony. I believe this has to do with the process of gauge calibration by the battery firmware, which is typically gradual. The battery may have lost some capacity, but being almost unused, the gauge still shows it to be close to design capacity, and it will take it some time to catch up to the actual situation.

I couldn't help but ask myself - what if I measured the combined effect of age and cycles? Would the trend be clearer? Unfortunately, such a chart is not easy to do in Excel, so I used MATLAB.

Image
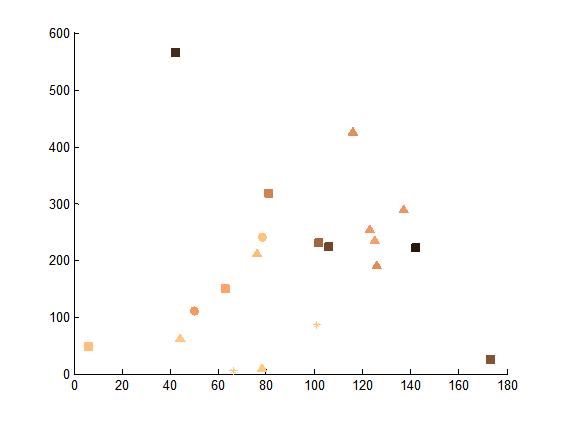
Figure 3. Capacity as a function of age (X) and cycles (Y). The range (0%-100%) is shown using the 'copper' colormap, with darker shades indicating lower capacity. Marks indicate different manufacturers: LGC - circle, Panasonic - triangle, Sanyo - square.

If there is a combined dependency, I would expect colors to get darker as you travel diagonally away from the origin. I am not convinced that such a trend exists, though; there are hints that it's there, but there are not enough data points to say anything conclusive.

Additional observations
  • It is said that battery life degrades less when stored partially charged. I suspect this is true, because the batteries (marked with *) that were out of use recently seem to be doing a little better than the others. However, it is not a night and day difference, and you should still expect them to degrade, even in storage.
  • All batteries lose charge when stored. Most of mine were put away with over 50% charge (sometimes over 80%). After a couple of years they were all at 0% or very close to it. If you have spare batteries in storage, I suggest to take them out and use them for 1-2 cycles a couple of times a year.
  • Old Sanyo batteries are known to have gauges that err on the low side, that is showing capacity which is far less than actual. The symptom will be that the battery will run down to 0% and stay there for a very long time before the laptop shuts down. My latest tests confirmed this yet again. In particular, T42-6c-1 which shows only ~6Wh, in reality probably has double that or even more. Running several consecutive cycles has been known to somewhat improve the accuracy, but I did not have time to do so now. I may end up doing it for fun later, and will update the results if I get something substantially different.
  • Newer Sanyo batteries (manufactured 2010 and onward) seem to be somewhat better than the old ones. Their capacity loss is lower, when compared to older batteries at earlier points of time. With LGC also demonstrating rather good results, I'd say that hunting for Panasonic-branded batteries is less important than it used to be, which is good news. I am still skeptical about Sony as I have not seen any conclusive effects that their new batteries are better than old ones. I switched to using the Sony 6-cell in my T410 just to see how it behaves over time.
So this is it. With such a major update I don't expect to make another one of similar magnitude any time soon, but a small one here and there may happen.

If you wish to add your battery data to the charts, I will happily do so, but only if it's done within the next month or two, and please run a battery reset before posting the numbers, to have a somewhat even ground for the batteries.

Edit (21-Jan-2017): Table and chart updated with data from UMPC2024's post.
Last edited by dr_st on Sun Jun 03, 2018 3:04 pm, edited 5 times in total.
Thinkpad 25 (20K7), T490 (20N3), Yoga 14 (20FY), T430s (IPS FHD + Classic Keyboard), X220 4291-4BG
X61 7673-V2V, T60 2007-QPG, T42 2373-F7G, X32 (IPS Screen), A31p w/ Ultrabay Numpad

UMPC2024
Junior Member
Junior Member
Posts: 250
Joined: Sun Nov 24, 2013 1:18 am
Location: Portland, OR

Re: Battery capacity charts - updated January 2017 (*PICS*)

#2 Post by UMPC2024 » Tue Jan 10, 2017 9:33 pm

Thanks for taking the time to update your post. You have a battery that's 14 years old?!

theterminator93
ThinkPadder
ThinkPadder
Posts: 1463
Joined: Fri Oct 11, 2013 7:45 pm
Location: North Ridgeville, Ohio, United States
Contact:

Re: Battery capacity charts - updated January 2017 (*PICS*)

#3 Post by theterminator93 » Tue Jan 10, 2017 10:05 pm

I have a Panasonic for the A31p which is also 14-15 years old. I will get info off it if I can remember to... last I remember it was good for about 25 Wh. I also have a few Ultrabay batteries for A series and a few more for T4*.
T480 with T25 keyboard | T25 | W520 i7-2860QM·Quadro 2000m·IPS FHD | T601F T9900·NVS 140m·LED AFFS UXGA
T420 IPS FHD | X220 IPS FHD | T61p·T61·43·42p|X13 Yoga G3·220T·301·41T·24·23·22|G41|A31p·22m|i1200|TransNote
600|770Z|770|760XD|760EL|701C|755C

dr_st
Admin
Admin
Posts: 9701
Joined: Sat Oct 29, 2005 6:20 am
Location: Israel

Re: Battery capacity charts - updated January 2017 (*PICS*)

#4 Post by dr_st » Wed Jan 11, 2017 3:36 am

UMPC2024 wrote:Thanks for taking the time to update your post. You have a battery that's 14 years old?!
Yes! It was purchased as NOS (new old stock) with the A31p I got from ajkula66 back in 2011. Hence the huge difference between manufacture and first use date.

Indeed what's a bit amazing is that of all these batteries, despite some being very weak, none flat out failed. Even the awful Sony X61 8-cell. Even batteries that spent >1 year at 0% charge levels (because I forgot to charge them). One doesn't have to go very far to hear of many examples of totally dead batteries, that I cannot help feeling a bit surprised here.

My only currently working non-Thinkpad laptop, a Compaq Evo N610c from 2002, had its battery fail while the laptop was left unused for several months, after ~4-5 years.
Thinkpad 25 (20K7), T490 (20N3), Yoga 14 (20FY), T430s (IPS FHD + Classic Keyboard), X220 4291-4BG
X61 7673-V2V, T60 2007-QPG, T42 2373-F7G, X32 (IPS Screen), A31p w/ Ultrabay Numpad

Puppy
Senior ThinkPadder
Senior ThinkPadder
Posts: 2821
Joined: Sat Oct 30, 2004 4:52 am
Location: Prague, Czech Republic

Re: Battery capacity charts - updated January 2017 (*PICS*)

#5 Post by Puppy » Wed Jan 11, 2017 4:40 pm

dr_st wrote:Old Sanyo batteries are known to have gauges that err on the low side, that is showing capacity which is far less than actual. The symptom will be that the battery will run down to 0% and stay there for a very long time before the laptop shuts down. My latest tests confirmed this yet again.
Interesting. My R51 Sanyo battery 08K8193 from Sep-2004 has 5.88 Wh capacity only of designed 47.52 Wh that is close to the 6.26 Wh in your table, the worst score. I have already tried several discharging cycles to 3% without noticeable effect. Next time I'll try the zero one.

What a difference to Panasonic one in my X31 manufactured in 2003 :!: that still keeps 65% of designed capacity.
ThinkPad (1992 - 2012): R51, X31, X220
Huawei MateBook 13

jdrou
Senior Member
Senior Member
Posts: 670
Joined: Tue Feb 10, 2009 6:15 pm
Location: Madison Heights, MI

Re: Battery capacity charts - updated January 2017 (*PICS*)

#6 Post by jdrou » Wed Jan 11, 2017 6:07 pm

Newer Sanyo batteries (manufactured 2010 and onward) seem to be somewhat better than the old ones.
Note for newer batteries: in 2009 Panasonic gained majority interest in Sanyo and in 2011 Sanyo became a wholly-owned subsidiary. Could explain this improvement.

[Edited for clarity.]
Last edited by jdrou on Mon Jun 04, 2018 3:52 pm, edited 2 times in total.
Current Thinkpads:
X31, X40, X61T, X61, X201, X220 (i7 IPS), W520 (FHD), T440p (FHD),
T480 (QHD)
Dells: Latitude C840, Precision M70, Precision M4400, M6400 (WUXGA), M6600, M6700, 7730, XPS 13
Daily driver: MS Surface Pro 7 (i7)

TPFanatic
Senior ThinkPadder
Senior ThinkPadder
Posts: 2234
Joined: Thu Jul 30, 2015 11:29 pm
Location: Boston, Massachusetts

Re: Battery capacity charts - updated January 2017 (*PICS*)

#7 Post by TPFanatic » Wed Jan 11, 2017 11:47 pm

I got a Z60m 6 cell from 2006, first used in 2007 at 64% original capacity. Panasonic 148 cycles. Not that great but better than Sanyos from the era.

Puppy
Senior ThinkPadder
Senior ThinkPadder
Posts: 2821
Joined: Sat Oct 30, 2004 4:52 am
Location: Prague, Czech Republic

Re: Battery capacity charts - updated January 2017 (*PICS*)

#8 Post by Puppy » Thu Jan 12, 2017 2:00 pm

dr_st wrote:Old Sanyo batteries are known to have gauges that err on the low side, that is showing capacity which is far less than actual. The symptom will be that the battery will run down to 0% and stay there for a very long time before the laptop shuts down.
I can confirm that, just tried it now. The battery is charging for 15 minutes, current went from initial 2.4 A to 1.5 A now but it still displays 0% remaining capacity. There seems to be no firmware update for this battery.
ThinkPad (1992 - 2012): R51, X31, X220
Huawei MateBook 13

bgx
Sophomore Member
Posts: 184
Joined: Mon Aug 24, 2009 11:56 am
Location: rennes, france

Re: Battery capacity charts - updated January 2017 (*PICS*)

#9 Post by bgx » Fri Jan 13, 2017 4:49 am

You need to know that Li-ion battery discharge is very related to the temperature and charge level.

at 28C and 100% charge, you would lose around 20% per year.
at 80%, it would be much lower, 8% if i recall, etc.

Of course, there are other rules, as less temperature = less capacity loss.
Also heavy discharge hurts the battery.

cycle count is known not to be too important for li ion.

Of course, the quality of the battery also plays a role and mitigate these numbers, but these rule of thumb stays.

We have a great tool with the thinkpad battery tool, allowing to cap the charge to some %.

On everyday use, i capped it at 70-80%, and charge it to 100% only when needed for long trips.

My data:
x60s,
Sanyo,
built 10/2010, first use 07/2011.
designed full capacity: 74.8W,
current full capacity: 63.3W.
number of cycles: 1118.

losing 5% of capacity per year would yield less than 58W. I am well above despite the very hight cycles count.

It does work!


Did the same with my old x40 battery, and i could see the same outcome.

edit:
on your chart:
Image

bgx
Sophomore Member
Posts: 184
Joined: Mon Aug 24, 2009 11:56 am
Location: rennes, france

Re: Battery capacity charts - updated January 2017 (*PICS*)

#10 Post by bgx » Fri Jan 13, 2017 5:22 am

"It is said that battery life degrades less when stored partially charged. I suspect this is true, because the batteries (marked with *) that were out of use recently seem to be doing a little better than the others. However, it is not a night and day difference, and you should still expect them to degrade, even in storage.
All batteries lose charge when stored. Most of mine were put away with over 50% charge (sometimes over 80%). After a couple of years they were all at 0% or very close to it. If you have spare batteries in storage, I suggest to take them out and use them for 1-2 cycles a couple of times a year."

With your storage method, at first, you battery capacity stays high, though it loses charge.
then the charge becomes low, too low, and this hurts the battery capacity.
So yes, the best is to store it at ~60%, and every~ 6 months charge it to ~60%.

dr_st
Admin
Admin
Posts: 9701
Joined: Sat Oct 29, 2005 6:20 am
Location: Israel

Re: Battery capacity charts - updated January 2017 (*PICS*)

#11 Post by dr_st » Fri Jan 13, 2017 8:20 am

bgx wrote: on your chart:
Image
The X coordinate seems wrong. From 10/2010 till now it's 75 months. But the number is very good for a Sanyo battery. It's quite possible that not charging to 100% helps with longevity.

I would love to see a good analysis of battery capacity loss as a function of charge level, with many data points. It's not something you can get from just users collecting statistics, since there will never be 100% identical environmental conditions, and since we actually use our batteries, with varying usage patterns.
Thinkpad 25 (20K7), T490 (20N3), Yoga 14 (20FY), T430s (IPS FHD + Classic Keyboard), X220 4291-4BG
X61 7673-V2V, T60 2007-QPG, T42 2373-F7G, X32 (IPS Screen), A31p w/ Ultrabay Numpad

bgx
Sophomore Member
Posts: 184
Joined: Mon Aug 24, 2009 11:56 am
Location: rennes, france

Re: Battery capacity charts - updated January 2017 (*PICS*)

#12 Post by bgx » Fri Jan 13, 2017 9:22 pm

ouch yes i [censored] up the diagram. did it during a talk, so was a bit in a hurry.


what i tell you come from a guy with a PhD in chemistry working on liion battery cell.
It s pretty solid.

And as i said, i confirmed it by following the principles and seeing what it gives.

1st year of x40 i didnt know and had my battery at ~100% most of the time and lost 15% of capacity.
Then the following years i took care of the battery and lost only around 5% a year. Same battery, different handling it does make a big difference.

So for sure, the way you charge and keep it charged matters a lot.

Now, of course, quality of battery has also an influence on the capacity, but that's not something we can control much once we have the battery. On the other hand, we can control how we keep the battery charged.

bgx
Sophomore Member
Posts: 184
Joined: Mon Aug 24, 2009 11:56 am
Location: rennes, france

Re: Battery capacity charts - updated January 2017 (*PICS*)

#13 Post by bgx » Fri Jan 13, 2017 9:25 pm

Something else you can see, your very old sanyo battery(per manufactured date) is not as bad the the slightly younger sanyo battery.

they follow more their first use, rather than their manufactured date. Again, that's because using it means usually keeping it at 100% most of the time.

UMPC2024
Junior Member
Junior Member
Posts: 250
Joined: Sun Nov 24, 2013 1:18 am
Location: Portland, OR

Re: Battery capacity charts - updated January 2017 (*PICS*)

#14 Post by UMPC2024 » Sat Jan 14, 2017 1:31 am

bgx wrote: On everyday use, i capped it at 70-80%, and charge it to 100% only when needed for long trips.

My data:
x60s,
Sanyo,
built 10/2010, first use 07/2011.
designed full capacity: 74.8W,
current full capacity: 63.3W.
number of cycles: 1118.

losing 5% of capacity per year would yield less than 58W. I am well above despite the very hight cycles count.
What were your average charge intervals for each charge (ie. 80% -> 30% each time?)

dr_st
Admin
Admin
Posts: 9701
Joined: Sat Oct 29, 2005 6:20 am
Location: Israel

Re: Battery capacity charts - updated January 2017 (*PICS*)

#15 Post by dr_st » Sat Jan 14, 2017 3:54 am

bgx wrote:they follow more their first use, rather than their manufactured date.
I don't think so. There is definitely a combination here - both parameters contribute. But I have a feeling that the manufacture date is more meaningful. Otherwise A31p-6c-1 would have higher capacity than T42-9c-1. As I said, I suspect that it just takes many cycles to successfully calibrate the gauge. The A31p battery only had a handful (25, of which just a few were full discharges). The reported capacity has been steadily falling with every new cycle; I believe it just does not reflect the actual situation yet. On the other hand, the T42 6-cell which shows 13% of original capacity, in truth is probably close to double that, because of the way their gauges behave.
bgx wrote:Now, of course, quality of battery has also an influence on the capacity, but that's not something we can control much once we have the battery. On the other hand, we can control how we keep the battery charged.
Indeed. What I would like to see is some sort of curve, showing capacity loss for different charge levels - Not just 80% versus 100%, say, but also 40%, 60%, 90%, 95%. This would allow to determine both optimal usage and optimal storage strategy.

Two anecdotes that I've seen go around is that 40% is the optimal level, so this is what you should store them at, and that the biggest long-term capacity loss occurs at charge levels over 95%, whereas 95% to 90%, 80% etc, is not so much. But I haven't seen proof of either claim. Perhaps as someone working in this field, you know of some good published papers and can direct us to them. :)
Thinkpad 25 (20K7), T490 (20N3), Yoga 14 (20FY), T430s (IPS FHD + Classic Keyboard), X220 4291-4BG
X61 7673-V2V, T60 2007-QPG, T42 2373-F7G, X32 (IPS Screen), A31p w/ Ultrabay Numpad

bgx
Sophomore Member
Posts: 184
Joined: Mon Aug 24, 2009 11:56 am
Location: rennes, france

Re: Battery capacity charts - updated January 2017 (*PICS*)

#16 Post by bgx » Sat Jan 14, 2017 8:17 am

Just to clarify. I am not the chemistry PhD guy. I talked to one, and he showed me some data.
He posted it on some webpage, but this is 10+ years ago, so i have to say that i totally lost the link and the data. Hopefully, shall not be so hard to find again.

As i recall, the capacity loss decreased sharply with the charge level (and temperature).

100%-80% is the most important charge level to avoid, indeed, (As I recall, you are at 8% loss per year for 80% of charge and 20% for 100% charge).
You have a bit you can win pass that: 60% should be 5%, etc. (this number works for 25C, but at 2C it is even better).

theoretically, keeping it at 20% capacity would be the best.
The problem is that disconnected, the battery losses charge, goes close to 0, which hurts it.

Hence more practically, it is better to keep it at 50% and charge it to 50% every once in a while to counter the barry loss.

He said that cycle count was not very important.

Also, he said that every once in a while, doing a full charge (but not keeping it at 100% afterwards) is better for the battery.

All of this applys to Li-ion, and these rules are very different with NiMh and other technology. (people have NiMh rules in mind usually when talkiong of LiIon and say bullsh-t because of that).

bgx
Sophomore Member
Posts: 184
Joined: Mon Aug 24, 2009 11:56 am
Location: rennes, france

Re: Battery capacity charts - updated January 2017 (*PICS*)

#17 Post by bgx » Sat Jan 14, 2017 8:25 am

Concerning manufacturing vs first use:

very old battery would reach 0% charge (which hurts it a lot) and stay there for a very long time (which hurts it as well I guess). But you wont get the charge level penalty of battery abused at 100%.

For different manufacturer, I wonder whether some (Pana, Sony) cant make sure the cells are never 100% charged (but from time to time?). That is they cell you a 90Wh battery which is rated at 78Wh and never fully charged at 90Wh.


For my personnal use, i set the battery to charge at 35% till 70%, unless I have a long trip or long day of work disconnecte in front of me.
AS you can see from my cycle count, I use it a lot from 70% => 20% and charging again.
Some days, i never reach the 35% cut so it wont charge at all. Anyway i am plugged in so it is fine.

35% is still 2hours which is fine for everyday use.

dr_st
Admin
Admin
Posts: 9701
Joined: Sat Oct 29, 2005 6:20 am
Location: Israel

Re: Battery capacity charts - updated January 2017 (*PICS*)

#18 Post by dr_st » Sat Jan 14, 2017 10:45 am

bgx wrote:100%-80% is the most important charge level to avoid, indeed, (As I recall, you are at 8% loss per year for 80% of charge and 20% for 100% charge).
The problem with charging the battery only to 80% is that you are giving up 20% capacity up front and permanently, unless you have strict discipline and can always plan ahead when you need the full capacity to charge it to 100%. But capping the charge at 95% would be a non-issue. That's why it's interesting to know where the capacity loss sits for 95% charge - is it closer to 100% or to 80%.
bgx wrote:For different manufacturer, I wonder whether some (Pana, Sony) cant make sure the cells are never 100% charged (but from time to time?). That is they cell you a 90Wh battery which is rated at 78Wh and never fully charged at 90Wh.
That would be a smart thing in engineering terms, but probably not so smart in economical terms. Advertised battery life is one of the main selling points of laptops, so manufacturers have an interest of maximizing the battery life on a new laptop. If they have a battery than can give X, they want to advertise X, not 0.9X or 0.8X. They couldn't care less what happens to it a year after purchase. In fact, with battery warranties typically being given for 1 year at most, the faster it degrades after that, the better for them - more batteries to sell.

However, recent Lenovo models have a "Maximum Lifespan Mode" for the battery, which, from my observation does something very similar to your proposal - it modifies the "full charge capacity" to report something less than actual (about 10% less, I think), and charges only to that level. Supposedly it adjusts it automatically according to some algorithm. In a sense, it's like the software is taking care of the custom charging threshold for you.
Thinkpad 25 (20K7), T490 (20N3), Yoga 14 (20FY), T430s (IPS FHD + Classic Keyboard), X220 4291-4BG
X61 7673-V2V, T60 2007-QPG, T42 2373-F7G, X32 (IPS Screen), A31p w/ Ultrabay Numpad

UMPC2024
Junior Member
Junior Member
Posts: 250
Joined: Sun Nov 24, 2013 1:18 am
Location: Portland, OR

Re: Battery capacity charts - updated January 2017 (*PICS*)

#19 Post by UMPC2024 » Sun Jan 15, 2017 8:00 pm

Here's my data
T430 2342-CTO, Intel Core i5-3380M @2.90 GHz, Intel HD Graphics 4000, 8GB RAM (from factory), 1366x768 screen, Windows 7 SP1 64-bit Home Premium

Code: Select all

  Battery	   FRU	    Brand	    Manufactured	First used	Design Capacity (Wh)	Age(months)	Cycles	Capacity (Wh)	% Original  Notes
 T430-6C-01	45N1001	Sanyo	        July-13	      Aug-13	        56.16           42	         566	     12.22	        21.76%        1
 T430-6C-02	45N1001	Sanyo	        July-16	      Oct-16	        56.16	        6	          48	      53.77	        95.74%        2
  
1st battery (came with computer): Sanyo 6-cell 70+, used with Hitachi 500 GB HDD (from factory) for first 2.5 years, Intel 535 series SSD until Dec. 2016
Condition: Yellow
Used on hybrid power boost for the first year until I realized that it uses the battery while charging (got to ~74% capacity, 41 Wh). Probably did Power Manager reset ~6 times, once per 100 charge cycles, then another around 520.

2nd battery (ordered from Lenovo.com as replacement): Sanyo 6-cell 70+, used with Intel 535 series SSD
Condition: Green

Usage: Discharge from 100 to 30% almost daily; charge mode: automatically optimize for battery lifespan. 30-Day standby on, always on USB off. Both on custom powerplan made in Lenovo Power Manager to have balanced and low settings (.ini config file available on request). Display brightness: 7. Alternate usage between 65W adapter, 90W adapter, 90W adapter + dock. No firmware updates on any of them.

dr_st
Admin
Admin
Posts: 9701
Joined: Sat Oct 29, 2005 6:20 am
Location: Israel

Re: Battery capacity charts - updated January 2017 (*PICS*)

#20 Post by dr_st » Mon Jan 16, 2017 6:09 am

Interesting data. I will incorporate it in the chart when I have time. The 3.5-year old battery really degraded very fast.
Thinkpad 25 (20K7), T490 (20N3), Yoga 14 (20FY), T430s (IPS FHD + Classic Keyboard), X220 4291-4BG
X61 7673-V2V, T60 2007-QPG, T42 2373-F7G, X32 (IPS Screen), A31p w/ Ultrabay Numpad

UMPC2024
Junior Member
Junior Member
Posts: 250
Joined: Sun Nov 24, 2013 1:18 am
Location: Portland, OR

Re: Battery capacity charts - updated January 2017 (*PICS*)

#21 Post by UMPC2024 » Tue Jan 17, 2017 1:38 am

Yeah... it's had at least 10 deep cycles through it (100% -> 7% or lower) which definitely did not help it. As for using almost daily, that only applied from August to November and February to May when I had school (and realistically it was 1.5 days). Otherwise, it was stored at 60% charge, with one cycle a month in December, June, and July.

bgx
Sophomore Member
Posts: 184
Joined: Mon Aug 24, 2009 11:56 am
Location: rennes, france

Re: Battery capacity charts - updated January 2017 (*PICS*)

#22 Post by bgx » Tue Jan 17, 2017 8:45 pm

several deep cycle: 100% -> 7%.

that is actually not a problem.

under 5% is a problem, but 100%-> 7% is actually good for your battery.

Problem 1 is staying at 100% (most of the case)
problem 2 is getting <5%.

the rest is not very important.

Concerning their algo, i get it, but i prefer to have the choice. Sometimes, i want my battery at 100%. If it s for 6 hours, its very fine. I prefer to decide rather than an algorithm.

Most of the time, i can live with 65% of battery max. Battery can go for 1 full day now, and i really seldom need it. But if it goes to 20% of the that after 5 years of abuse, then i am unhappy.

Sure, some will need it far from plug for all day every other day, and for them, what i propose does not work.

UMPC2024
Junior Member
Junior Member
Posts: 250
Joined: Sun Nov 24, 2013 1:18 am
Location: Portland, OR

Re: Battery capacity charts - updated January 2017 (*PICS*)

#23 Post by UMPC2024 » Wed Jan 18, 2017 12:50 am

bgx wrote:several deep cycle: 100% -> 7%.

that is actually not a problem.

under 5% is a problem, but 100%-> 7% is actually good for your battery.

Problem 1 is staying at 100% (most of the case)
problem 2 is getting <5%.
I'm not sure if it's because we're using batteries from different generations, but I'd have to disagree with you on this. The deep cycles pretty much killed my 1st battery because I was at 31.77 Wh at 510 charge cycles and then it decreased to 26.54 Wh at 514 charge cycles when I let it go down to 7% somewhere between those charges.
bgx wrote:Concerning their algo, i get it, but i prefer to have the choice. Sometimes, i want my battery at 100%. If it s for 6 hours, its very fine. I prefer to decide rather than an algorithm.
Do you mean being able to set custom thresholds? For some reason when I set something like 30% to 80% in Power Manager 6, it starts charging up to 30% when I'm using the laptop, but doesn't continue charging to 80% until I shut it down. It got too tiresome to have to do this, and the algorithm changes it to "Maximum Lifespan" mode with the green battery outline if I don't use it for a while.

dr_st
Admin
Admin
Posts: 9701
Joined: Sat Oct 29, 2005 6:20 am
Location: Israel

Re: Battery capacity charts - updated January 2017 (*PICS*)

#24 Post by dr_st » Wed Jan 18, 2017 3:14 am

UMPC2024 wrote:I'm not sure if it's because we're using batteries from different generations, but I'd have to disagree with you on this. The deep cycles pretty much killed my 1st battery because I was at 31.77 Wh at 510 charge cycles and then it decreased to 26.54 Wh at 514 charge cycles when I let it go down to 7% somewhere between those charges.
That does not mean anything necessarily. It may have been at ~26.54 all along, and you just didn't know it until you went under 7%. It's not that you lost capacity by using it down to 7%, but just the gauge calibration algorithm did not figure out that capacity was lost before you did.

Think of it this way - if you never really use your battery and keep it between 96% and 100% for 5 years, it will appear that the full charge capacity did not change at all. But that's bogus - as soon as you try using it and it suddenly drops fast at a certain point, you will understand that capacity has been lost. That's usually when the gauge figures it out too.
Thinkpad 25 (20K7), T490 (20N3), Yoga 14 (20FY), T430s (IPS FHD + Classic Keyboard), X220 4291-4BG
X61 7673-V2V, T60 2007-QPG, T42 2373-F7G, X32 (IPS Screen), A31p w/ Ultrabay Numpad

bgx
Sophomore Member
Posts: 184
Joined: Mon Aug 24, 2009 11:56 am
Location: rennes, france

Re: Battery capacity charts - updated January 2017 (*PICS*)

#25 Post by bgx » Wed Jan 18, 2017 3:23 am

exactly, dont blame the thermometer (cycle 100%->7%), blame the disease :).

dr_st
Admin
Admin
Posts: 9701
Joined: Sat Oct 29, 2005 6:20 am
Location: Israel

Re: Battery capacity charts - updated January 2017 (*PICS*)

#26 Post by dr_st » Sat Jan 21, 2017 4:47 pm

For example - since I made this post, I've noticed that the T430s battery has a sudden drop somewhere between 20% and 5%. The gauge, therefore, must have been inaccurate. Sure enough, after another calibration - the full charge capacity updated down to 38.97Wh. It is likely that if I had never run this battery down under 30%, I would not have noticed.
Thinkpad 25 (20K7), T490 (20N3), Yoga 14 (20FY), T430s (IPS FHD + Classic Keyboard), X220 4291-4BG
X61 7673-V2V, T60 2007-QPG, T42 2373-F7G, X32 (IPS Screen), A31p w/ Ultrabay Numpad

automobus
Senior Member
Senior Member
Posts: 546
Joined: Sun Jan 24, 2010 5:32 pm
Location: USA : Illinois : Chicago

seven years old NOS SANYO

#27 Post by automobus » Sun Jan 22, 2017 1:42 am

Four months ago, someone near me got a new-condition old stock (NOS) battery for α60 (SANYO nine cell). Initial capacity of Battery2009-08-01 at break-in was between 86-87 Wh. Now, Battery2009-08-01 is up to 106 cycles, capacity is 76.54 Wh.

Puppy
Senior ThinkPadder
Senior ThinkPadder
Posts: 2821
Joined: Sat Oct 30, 2004 4:52 am
Location: Prague, Czech Republic

Re: Battery capacity charts - updated January 2017 (*PICS*)

#28 Post by Puppy » Sun Jan 22, 2017 5:48 am

My data:

Code: Select all

Battery   FRU      Brand      Manufactured  First used  Design Capacity (Wh)  Age(months)  Cycles  Capacity (Wh)  % Original  Notes
R51-6C    08K8193  Sanyo      Sep-2004      Oct-2004    47.52                 148          70      4.98           10.48
X31-6C    08K8039  Panasonic  Dec-2003      Apr-2005    47.52                 157          228     30.12          63.38       1
X220-6C   42T4861  Sanyo      Mar-2012      Apr-2012    57.72                 58           20      42.41          73.47       2
Tablet8   45N1715  Sanyo      Jun-2014      Dec-2014    20.47                 31           389     18.40          89.88       3
1 - the X31 is refurbished machine bought via Usanotebook, the rest are new ones.
2 - there is a battery firmware update available but user experiences are mixed (dead battery) so i decided to not apply it.
3 - the remaining capacity value is not very accurate and drops quickly. After discharge to 5% and full charge it goes usually to ~19.50 Wh for a while. It is Li-Pol battery.

I have also doubts about the cycles value accuracy. I don't use any special battery care, default charge thresholds are used.
ThinkPad (1992 - 2012): R51, X31, X220
Huawei MateBook 13

dr_st
Admin
Admin
Posts: 9701
Joined: Sat Oct 29, 2005 6:20 am
Location: Israel

Re: Battery capacity charts - updated January 2017 (*PICS*)

#29 Post by dr_st » Sun Jun 03, 2018 3:01 pm

Well, today I've experienced the first downright failure of a battery in my sample set. The battery that failed is the T60 Sanyo 6-cell, which was approaching its 10th birthday. The failure has the well-known symptoms: battery light flashes orange, battery won't charge, and the Power Manager displays the "A battery error has occured" or "The battery has failed due to normal wear" message (depending on software version).

Battery data (the first line is the previous measurement in January 2017; the second line is the current measurement, from today, prior to failure):

Code: Select all

  Battery    FRU     Brand  Manufactured First used Measurement Age(months) Cycles Capacity (Wh) % Original      Notes
  T60-6c-2 42T4504   Sanyo    Jul-08       Dec-08     Jan-17       102       231       28.40        50.57%
  T60-6c-2 42T4504   Sanyo    Jul-08       Dec-08     Jun-18       127       258       16.51        29.40%   BATTERY FAILED
In the last half-year or so, that battery was used occasionally. It was typically not charged fully, nor depleted. As the table shows, it degraded considerably in the past year and a half, losing almost 50% of the already reduced capacity. Today when I powered it on, it was around 60% when the failure message was displayed, and now it's around 35%. The laptop can still run off this battery, but once it's empty it will not charge again. At that point it should be recycled, and not used inside the machine, as it is known that a dead battery causes lock-ups in T60 machines, and, who knows, may even damage the charging circuit, so why risk it?

Meanwhile, the even older Panasonic battery is still kicking is this T60 I'm typing on, although capacity degraded a bit as well.

Code: Select all

  Battery    FRU     Brand  Manufactured First used Measurement Age(months) Cycles Capacity (Wh) % Original
  T60-6c-1 92P1139 Panasonic  Jul-06       Aug-06     Jan-17       126       190       40.08        71.37%
  T60-6c-1 92P1139 Panasonic  Jul-06       Aug-06     Jun-18       143       213       38.98        69.40%
Thinkpad 25 (20K7), T490 (20N3), Yoga 14 (20FY), T430s (IPS FHD + Classic Keyboard), X220 4291-4BG
X61 7673-V2V, T60 2007-QPG, T42 2373-F7G, X32 (IPS Screen), A31p w/ Ultrabay Numpad

dr_st
Admin
Admin
Posts: 9701
Joined: Sat Oct 29, 2005 6:20 am
Location: Israel

Re: Battery capacity charts - updated January 2017 (*PICS*)

#30 Post by dr_st » Sun May 16, 2021 1:59 pm

I was doing a battery rotation, where I charge the batteries that spend most of their time in storage, and found out that another one in my stash had failed between the last rotation and today (with the "due to normal wear" error).

Unfortunately, this time it's one I hoped to keep on using every now and then - the 6-cell for the X220.

Here is an updated chart of just the X220 batteries (May 2021):

Code: Select all

  Battery    FRU     Brand  Manufactured First used Age(months) Cycles Capacity (Wh) % Original    Notes

 X220-9c-1 42T4940   Sanyo    Oct-11       Jan-12       115      155       71.61        76.80%     Used very rarely
 X220-6c-1 45N1025   LGC      Nov-12       Feb-14       102      172       38.58        66.84%     BATTERY FAILED :(
 X220-4c-1 45N1019   Sanyo    Nov-15       Sep-16        66       94       18.49        64.07%     Used regularly
BTW, one thing I noticed is that after about a minute, the failed battery "disappears" and Power Manager shows an X in the status bar and a "battery not detected" message. I find this to be a good feature - to disconnect a faulty battery so that it cannot affect the rest of the machine. I don't think it worked this way on older laptops (like the T60) and there have been all sorts of bizarre issues reported when running a laptop with a dead battery.
Thinkpad 25 (20K7), T490 (20N3), Yoga 14 (20FY), T430s (IPS FHD + Classic Keyboard), X220 4291-4BG
X61 7673-V2V, T60 2007-QPG, T42 2373-F7G, X32 (IPS Screen), A31p w/ Ultrabay Numpad

Post Reply
  • Similar Topics
    Replies
    Views
    Last post

Return to “GENERAL ThinkPad News/Comments & Questions”

Who is online

Users browsing this forum: No registered users and 10 guests